In this blog article All Metals Fabrication (AMF) is introducing how useful the concepts of statistical sampling and Normal bell curves can be to help meeting some of our customer’s quality-fabrication objectives. AMF has used this technique in a recent discussion with one of our customers, Killer Filter, to measure variation on parts we laser-cut and form for them.
Using our data and the associated graph helped both AMF and Killer Filter conceptualize the normal variation that is inherent to the press brake forming process. It, in fact, led to Killer Filter easing tolerances, when possible, on their drawing requirements.
Statistical sampling is a widely used technique in quality control and process improvement. Sampling, as it implies, uses a subset of a larger population of components or parts. Data collected from this subset allows us to make inferences about the entire population.
One important statistical concept that is often associated with sampling is the normal bell curve—something you probably saw, or learned about in school, but quickly forgot because it wouldn’t apply in your life, or so you thought. Below, we will explore the basics of statistical sampling and the normal bell curve and how they can be applied here at AMF.
Statistical sampling is a method used to estimate characteristics of a population based on a subset, or sample, of that population. For metal fabrication, a population may refer to a large batch of metal components (think a large stack of parts), and a sample is a smaller, representative subset (think of pulling out a few parts from that large stack) that are selected for inspection or measurement.
Sampling is often more feasible and cost-effective than measuring or inspecting every single component in a large population, especially when the population size is large, or the inspection process is time-consuming or costly. When measured, recorded and tracked, sampling allows us to obtain a reasonable estimate of the quality or performance of a larger. The accuracy of the estimate depends on the sampling method used, the sample size, and the variability within the population. Properly designed and executed sampling plans can provide valuable information for decision-making in any of our work centers.
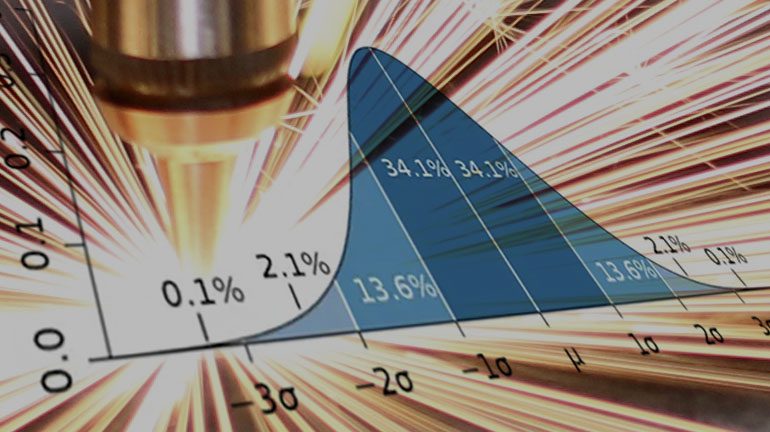
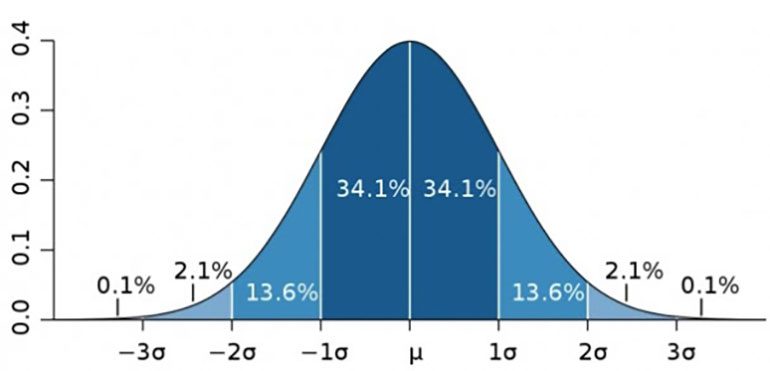
The normal bell curve is a probability distribution that is commonly used in statistics to describe the behavior of any naturally occurring events. It is called a bell curve because it is shaped like a bell. (See below)
1 Normal Distribution Curve µ = Mean σ = standard deviation (Sigma)
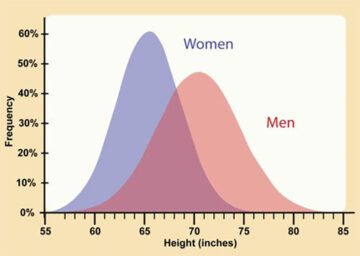
A very relatable example of how a distribution curve has been used in real life was done by taking a random sample of male and female height and applying the data in a normal bell curve. Notice how men have a curve that is less tall (on the frequency scale) and more widely distributed than women.
The normal bell curve can be used to describe the distribution of a particular characteristic in any manufacturing process. Take, for example, dimensional measurements at the press brake (or any other work center including flat sheet laser cutting, tube laser cutting, forming and welding).
The mean value of the distribution represents the average or expected value of the characteristic, while the spread or variability of the distribution is represented by the standard deviation.
The normal bell curve is important in statistical sampling because it provides insights into the expected distribution of the characteristics in the population. In other words, normal curves can help predict process variability and the amount of natural or normal variation in a given process.
Variability can also occur due to setup between multiple process or batch runs. These things are considered natural or process variation. If large outliers or extreme values are found that distort a normal bell curve these are considered unnatural occurrences or abnormalities. Finding abnormalities is very helpful because it makes it easier to determine the root cause and put in place corrective actions to prevent those occurrences in the future. In other words, it helps us fabricate parts better as we drive down to root causation in our every day metal fabrication work.
Application of Statistical Sampling and the Normal Bell Curve can be applied in various ways in metal fabrication processes to improve quality and performance. Here are some examples:
In summary, statistical sampling and the normal bell curve are valuable tools in manufacturing and the metal fabrication processes for quality control and process improvement. By properly designing and executing sampling plans and interpreting the results using the normal bell curve, AMF can make informed decisions about the quality and performance of their products, identify process variations or abnormalities, and drive continuous improvement efforts.
Understanding the concepts of statistical sampling and the normal bell curve is becoming a great way for AMF to ensure consistent quality and performance of their metal fabricated parts, leading to improved customer satisfaction and business success.

Rich Marker is an 18 year, skilled professional in metal fabrication and manufacturing. Co-founder, owner and principal of All Metals Fabrication, Rich has helped to sustain the company’s success over a variety of economic conditions. He has extensive background in continuous improvement, training and process improvement, and emotional intelligence—among other specialized proficiencies. He loves to learn, fly fish, watch college football and devour NY style pizza! He has the best family on earth, loves a good plan, great teaching and the opportunity to get better.
Learn More